 Catalogue PIGMA
10 km
Type of resources
Available actions
Topics
Keywords
Contact for the resource
Provided by
Years
Formats
Representation types
Update frequencies
status
Resolution
-
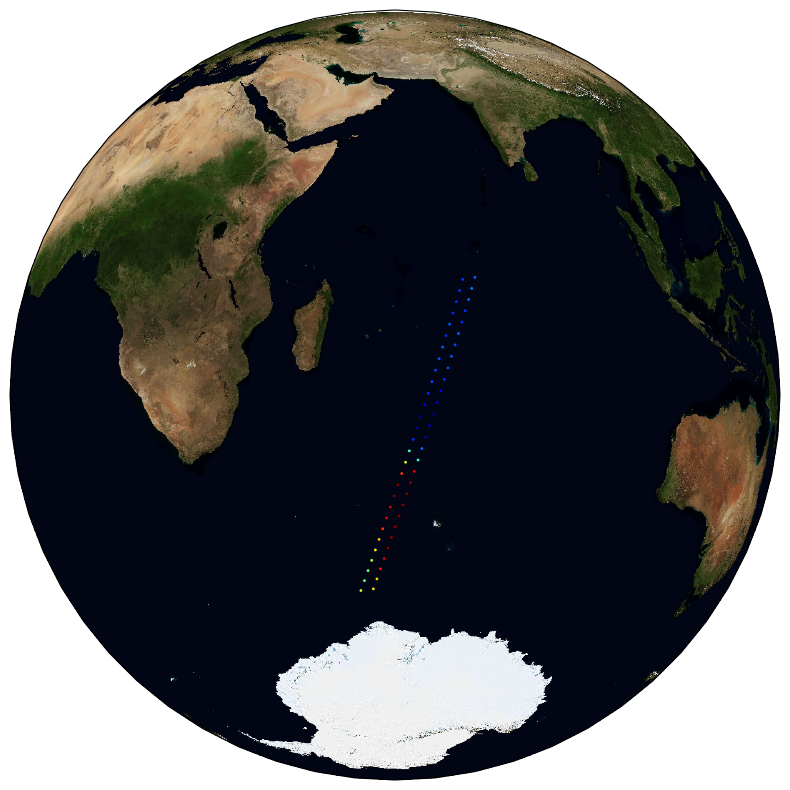
The ESA Sea State Climate Change Initiative (CCI) project has produced global multi-sensor time-series of along-track satellite synthetic aperture radar (SAR) integrated sea state parameters (ISSP) data from Sentinel-1 (referred to as SAR WV onboard Sentinel-1 Level 2P (L2P) ISSP data) with a particular focus for use in climate studies. This dataset contains the Sentinel-1 SAR Remote Sensing Integrated Sea State Parameter product (v1.0), which forms part of the ESA Sea State CCI version 3.0 release. This product provides along-track primary significant wave height measurements and secondary sea state parameters, calibrated with CMEMS model data and reference in situ measurements at 20km resolution every 100km, processed using the Pleskachevsky et. al., 2021 emprical model, separated per satellite and pass, including all measurements with flags and uncertainty estimates. These are expert products with rich content and no data loss. The SAR Wave Mode data used in the Sea State CCI SAR WV onboard Sentinel-1 Level 2P (L2P) ISSP v3 dataset come from the Sentinel-1 satellite missions spanning from 2014 to 2021 (Sentinel-1 A, Sentinel-1 B).
-
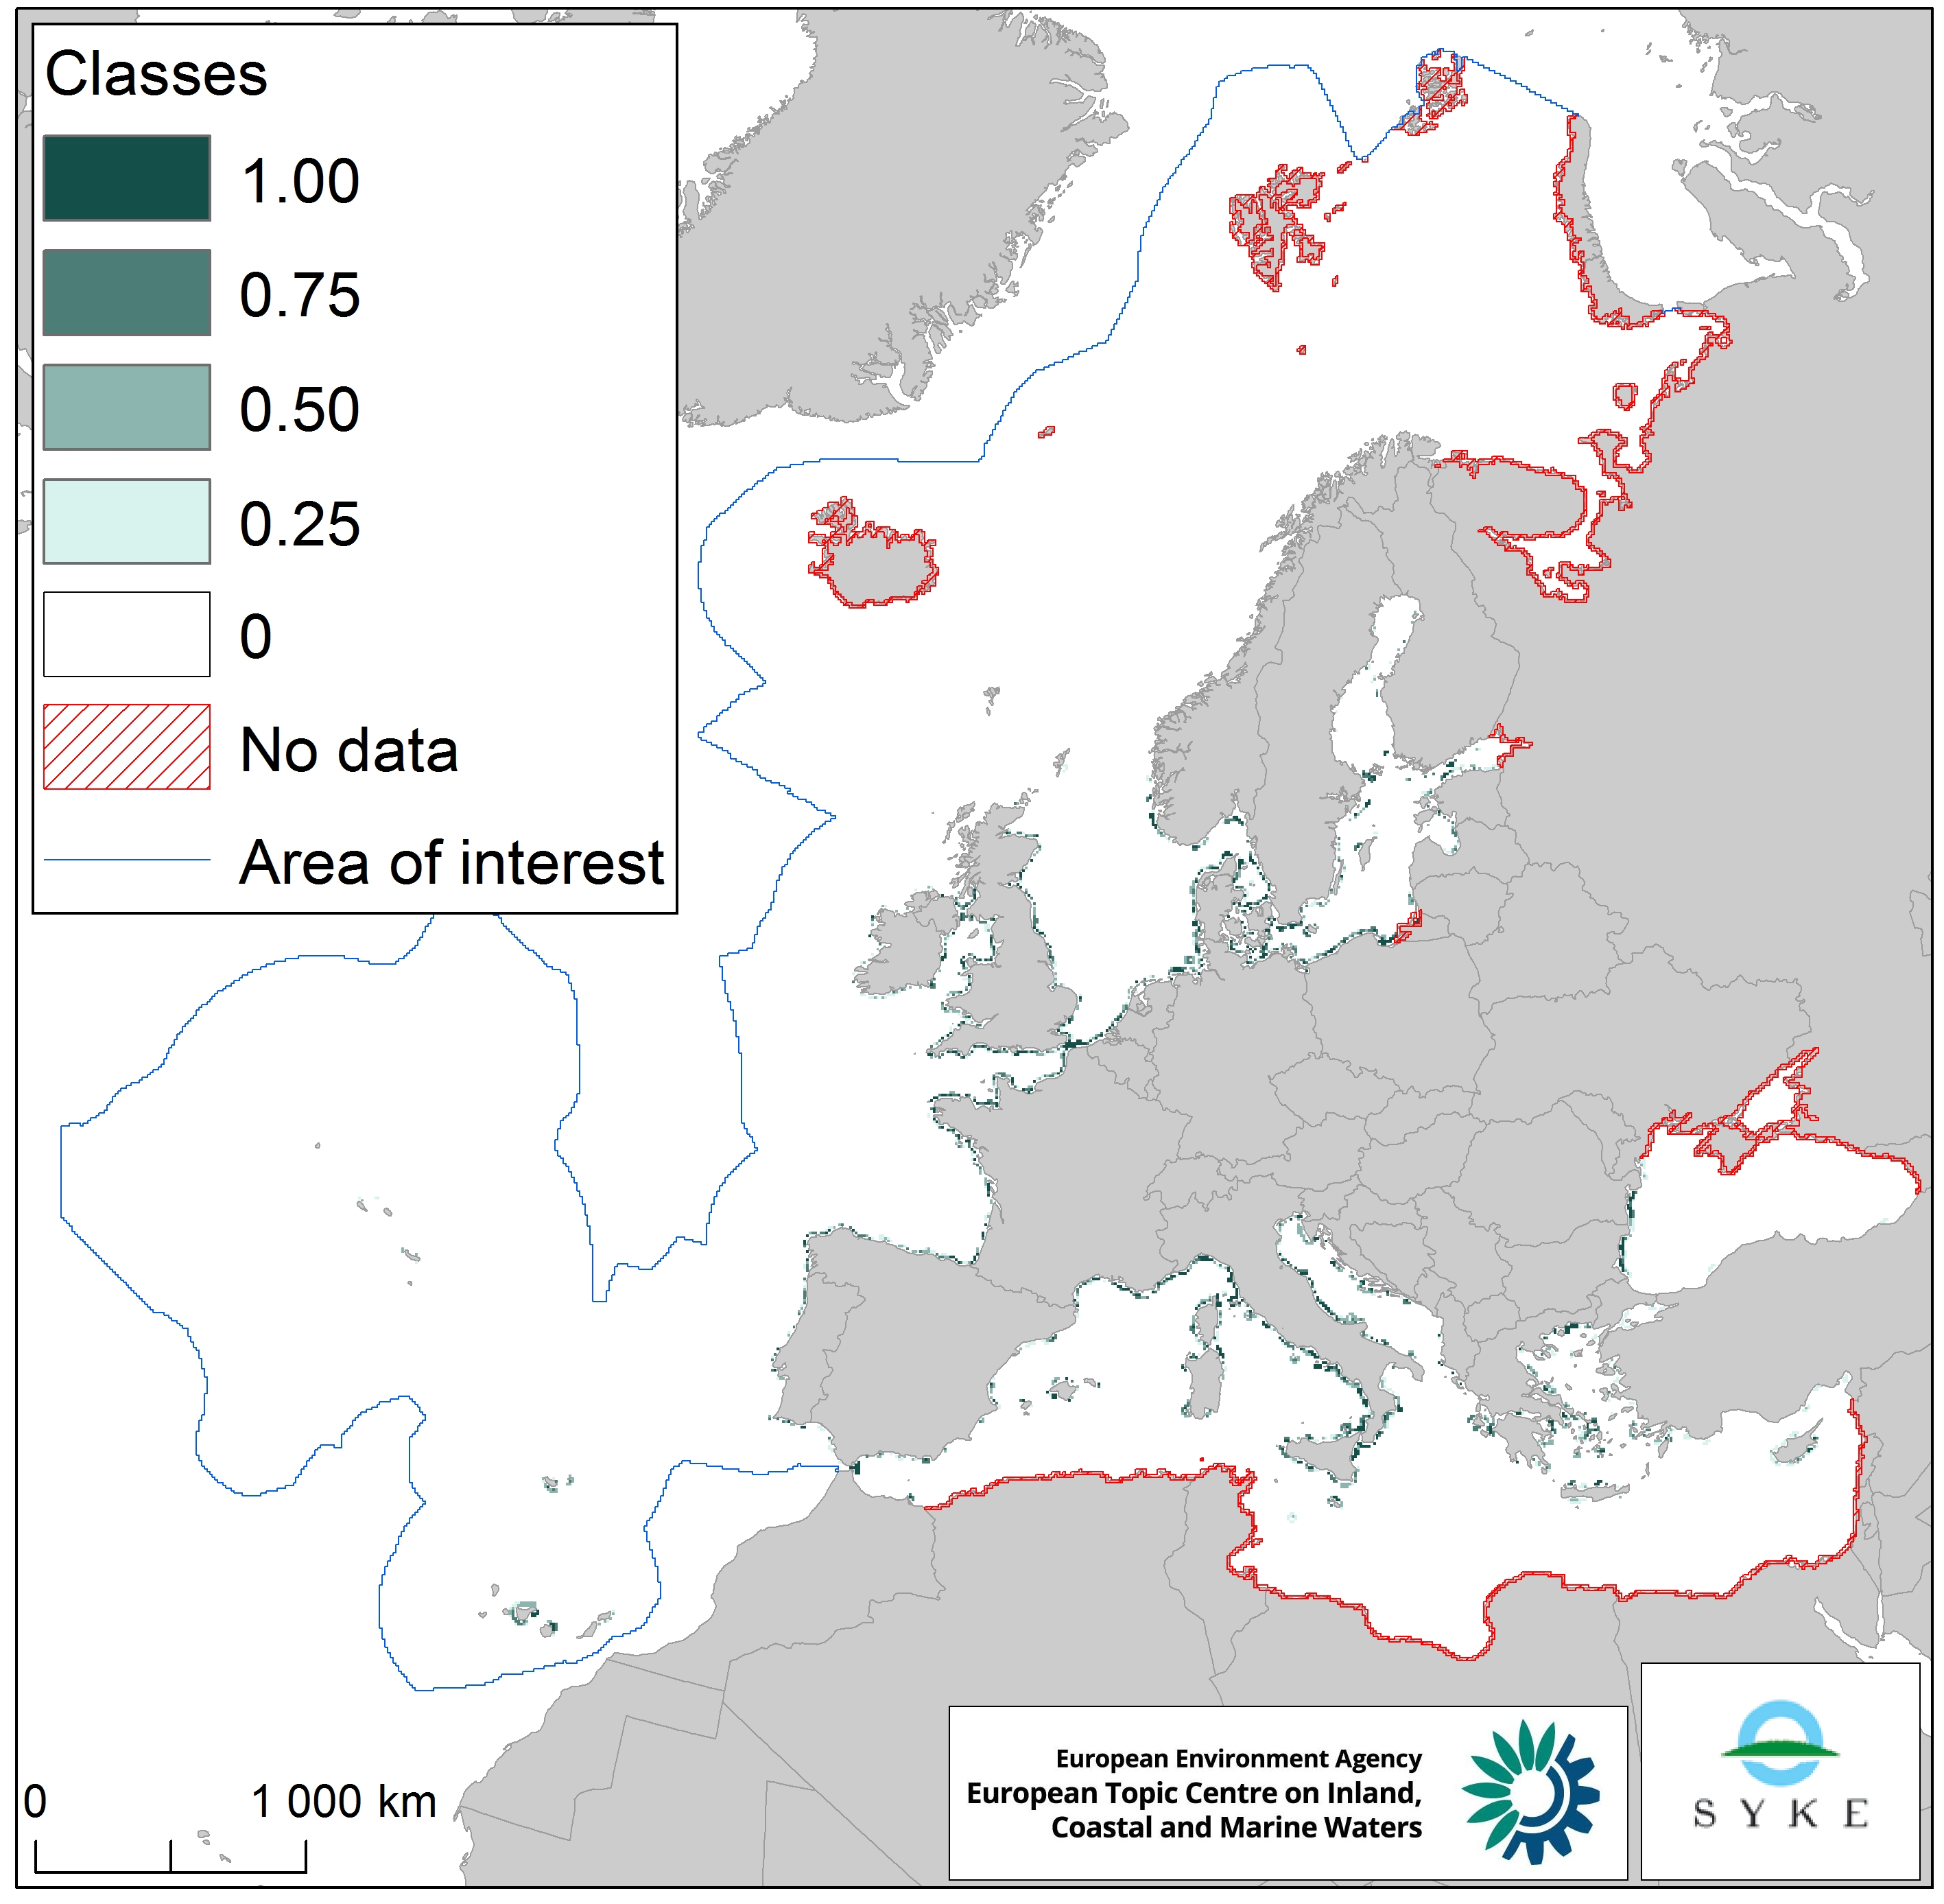
This raster dataset represents the input of microbial pathogens along the European coastlines. The pressure layer was created using three different datasets rasterized using the EEA 10 km grid: urban agglomerations reported under the Urban Waste Water Treatment Directive (2017), EMODnet dataset of ports lying on the sea coast together with passenger information (annual average 2006-2016) and Intestinal enterococci and Escherichia coli data at bathing sites as measured under the Bathing Water Directive reporting obligation (average 2008-2016). All three datasets were then classified into four classes, aggregated and classified again (quantile classes between 0 and 1, with the latter being the highest pathogen pressure). This dataset has been prepared for the calculation of the combined effect index, produced for the ETC/ICM Report 4/2019 "Multiple pressures and their combined effects in Europe's seas" available on: https://www.eionet.europa.eu/etcs/etc-icm/etc-icm-report-4-2019-multiple-pressures-and-their-combined-effects-in-europes-seas-1.
-
This raster dataset represents the physical loss of the seabed in the European seas. Physical habitat loss is an extreme pressure on the marine ecosystem which was defined to include all impacts on the seabed which take more than 12 years to recover, a time span influencing even long living marine mammals and seabirds. Habitat is lost if its substrate, morphology or topography is permanently altered. The dataset is an aggregation of several different human activities that cause physical loss in the seabed: dredging and dumping of dredged material, oil and gas rigs, offshore installations, ports, sand and gravel extraction and windfarms. The resulting dataset is a raster (10km grid cell) derived from EMODnet, MED-IAMER and 4C Offshore datasets and with temporal reference from 2012 to 2017. Higher values mean more loss causing activity in the area. Due to its resolution, loss causing activity in a cell does not usually mean that all the seabed habitat in the area is lost. This dataset has been prepared for the calculation of the combined effect index, produced for the ETC/ICM Report 4/2019 "Multiple pressures and their combined effects in Europe's seas" available on: https://www.eionet.europa.eu/etcs/etc-icm/etc-icm-report-4-2019-multiple-pressures-and-their-combined-effects-in-europes-seas-1.
-
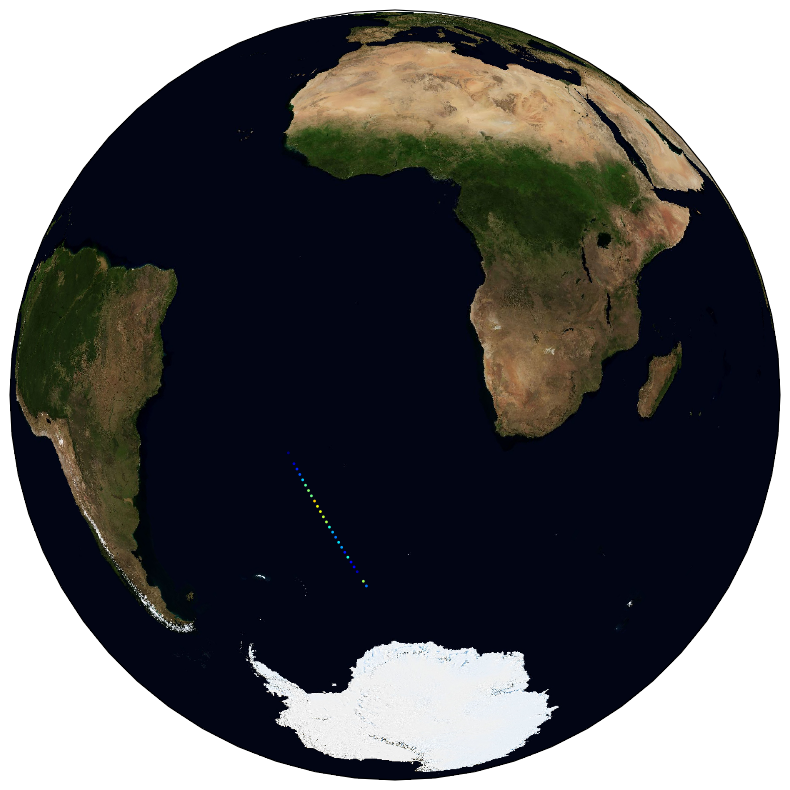
The ESA Sea State Climate Change Initiative (CCI) project has produced global multi-sensor time-series of along-track satellite synthetic aperture radar (SAR) integrated sea state parameters (ISSP) data from ENVISAT (referred to as SAR Wave Mode onboard ENVISAT Level 2P (L2P) ISSP data) with a particular focus for use in climate studies. This dataset contains the ENVISAT Remote Sensing Integrated Sea State Parameter product (version 1.1), which forms part of the ESA Sea State CCI version 3.0 release. This product provides along-track significant wave height (SWH) measurements at 5km resolution every 100km, processed using the Li et al., 2020 empirical model, separated per satellite and pass, including all measurements with flags and uncertainty estimates. These are expert products with rich content and no data loss. The SAR Wave Mode data used in the Sea State CCI SAR WV onboard ENVISAT Level 2P (L2P) ISSP v3 dataset come from the ENVISAT satellite mission spanning from 2002 to 2012.
-
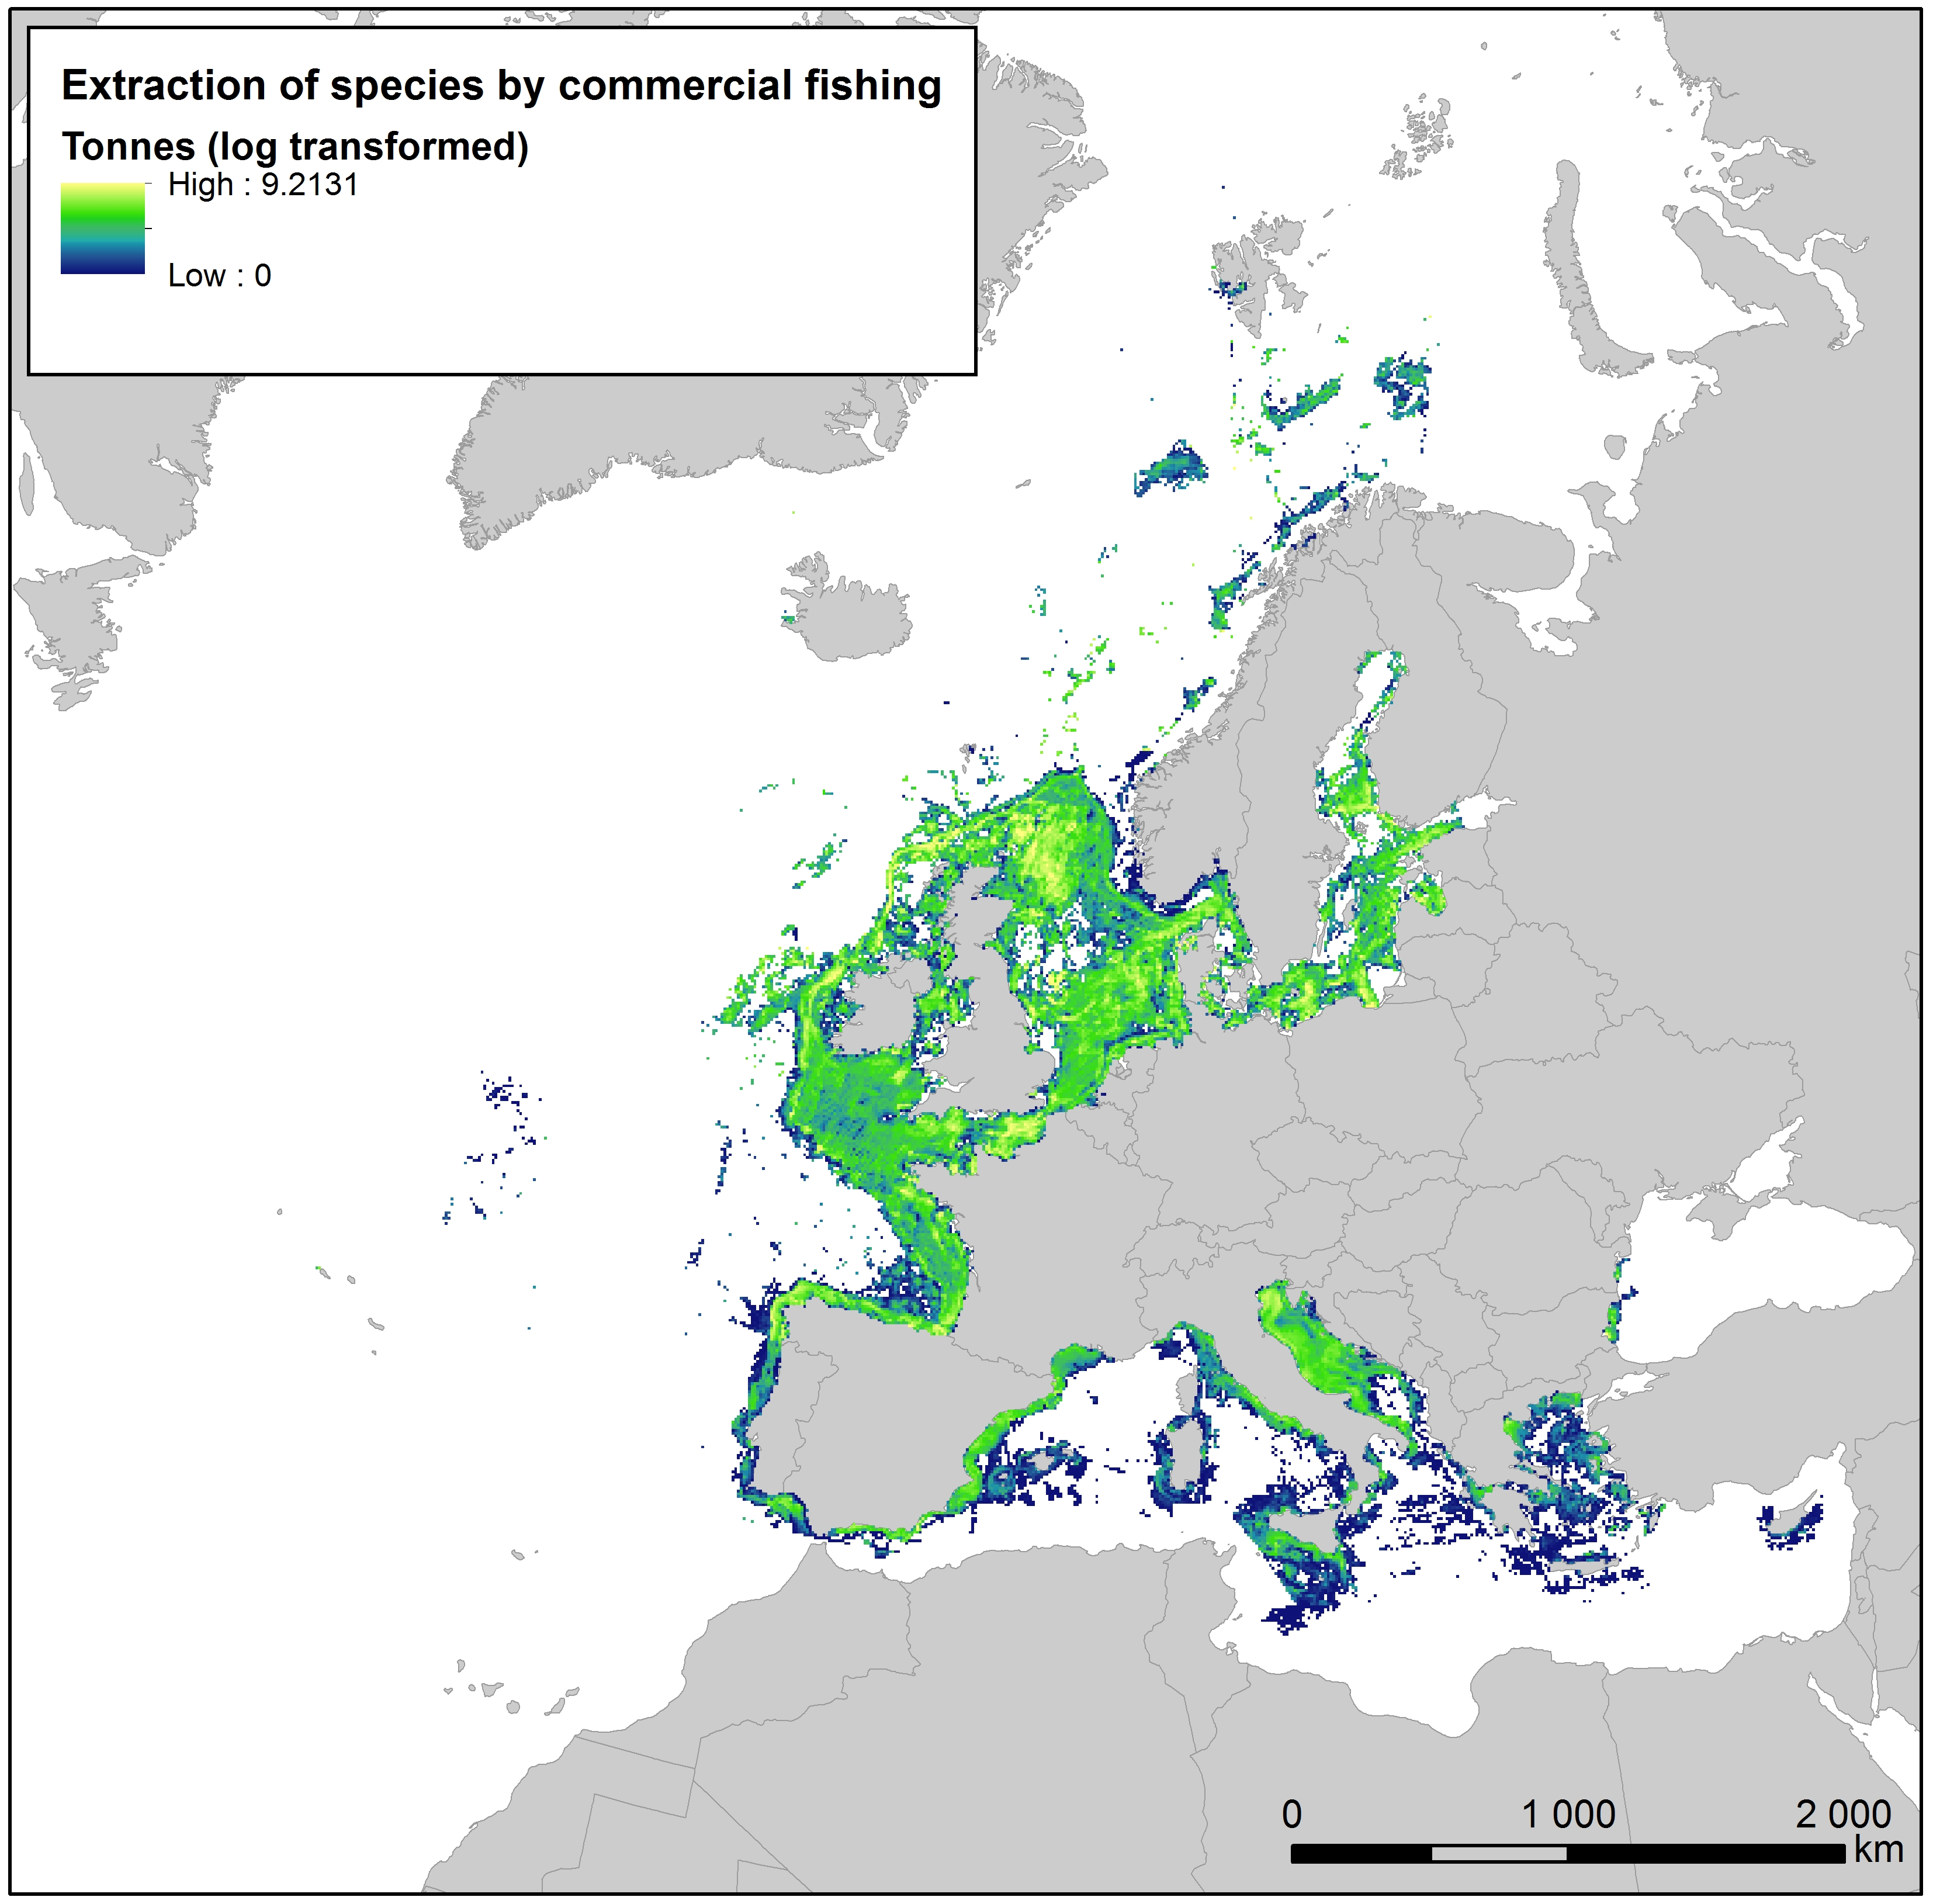
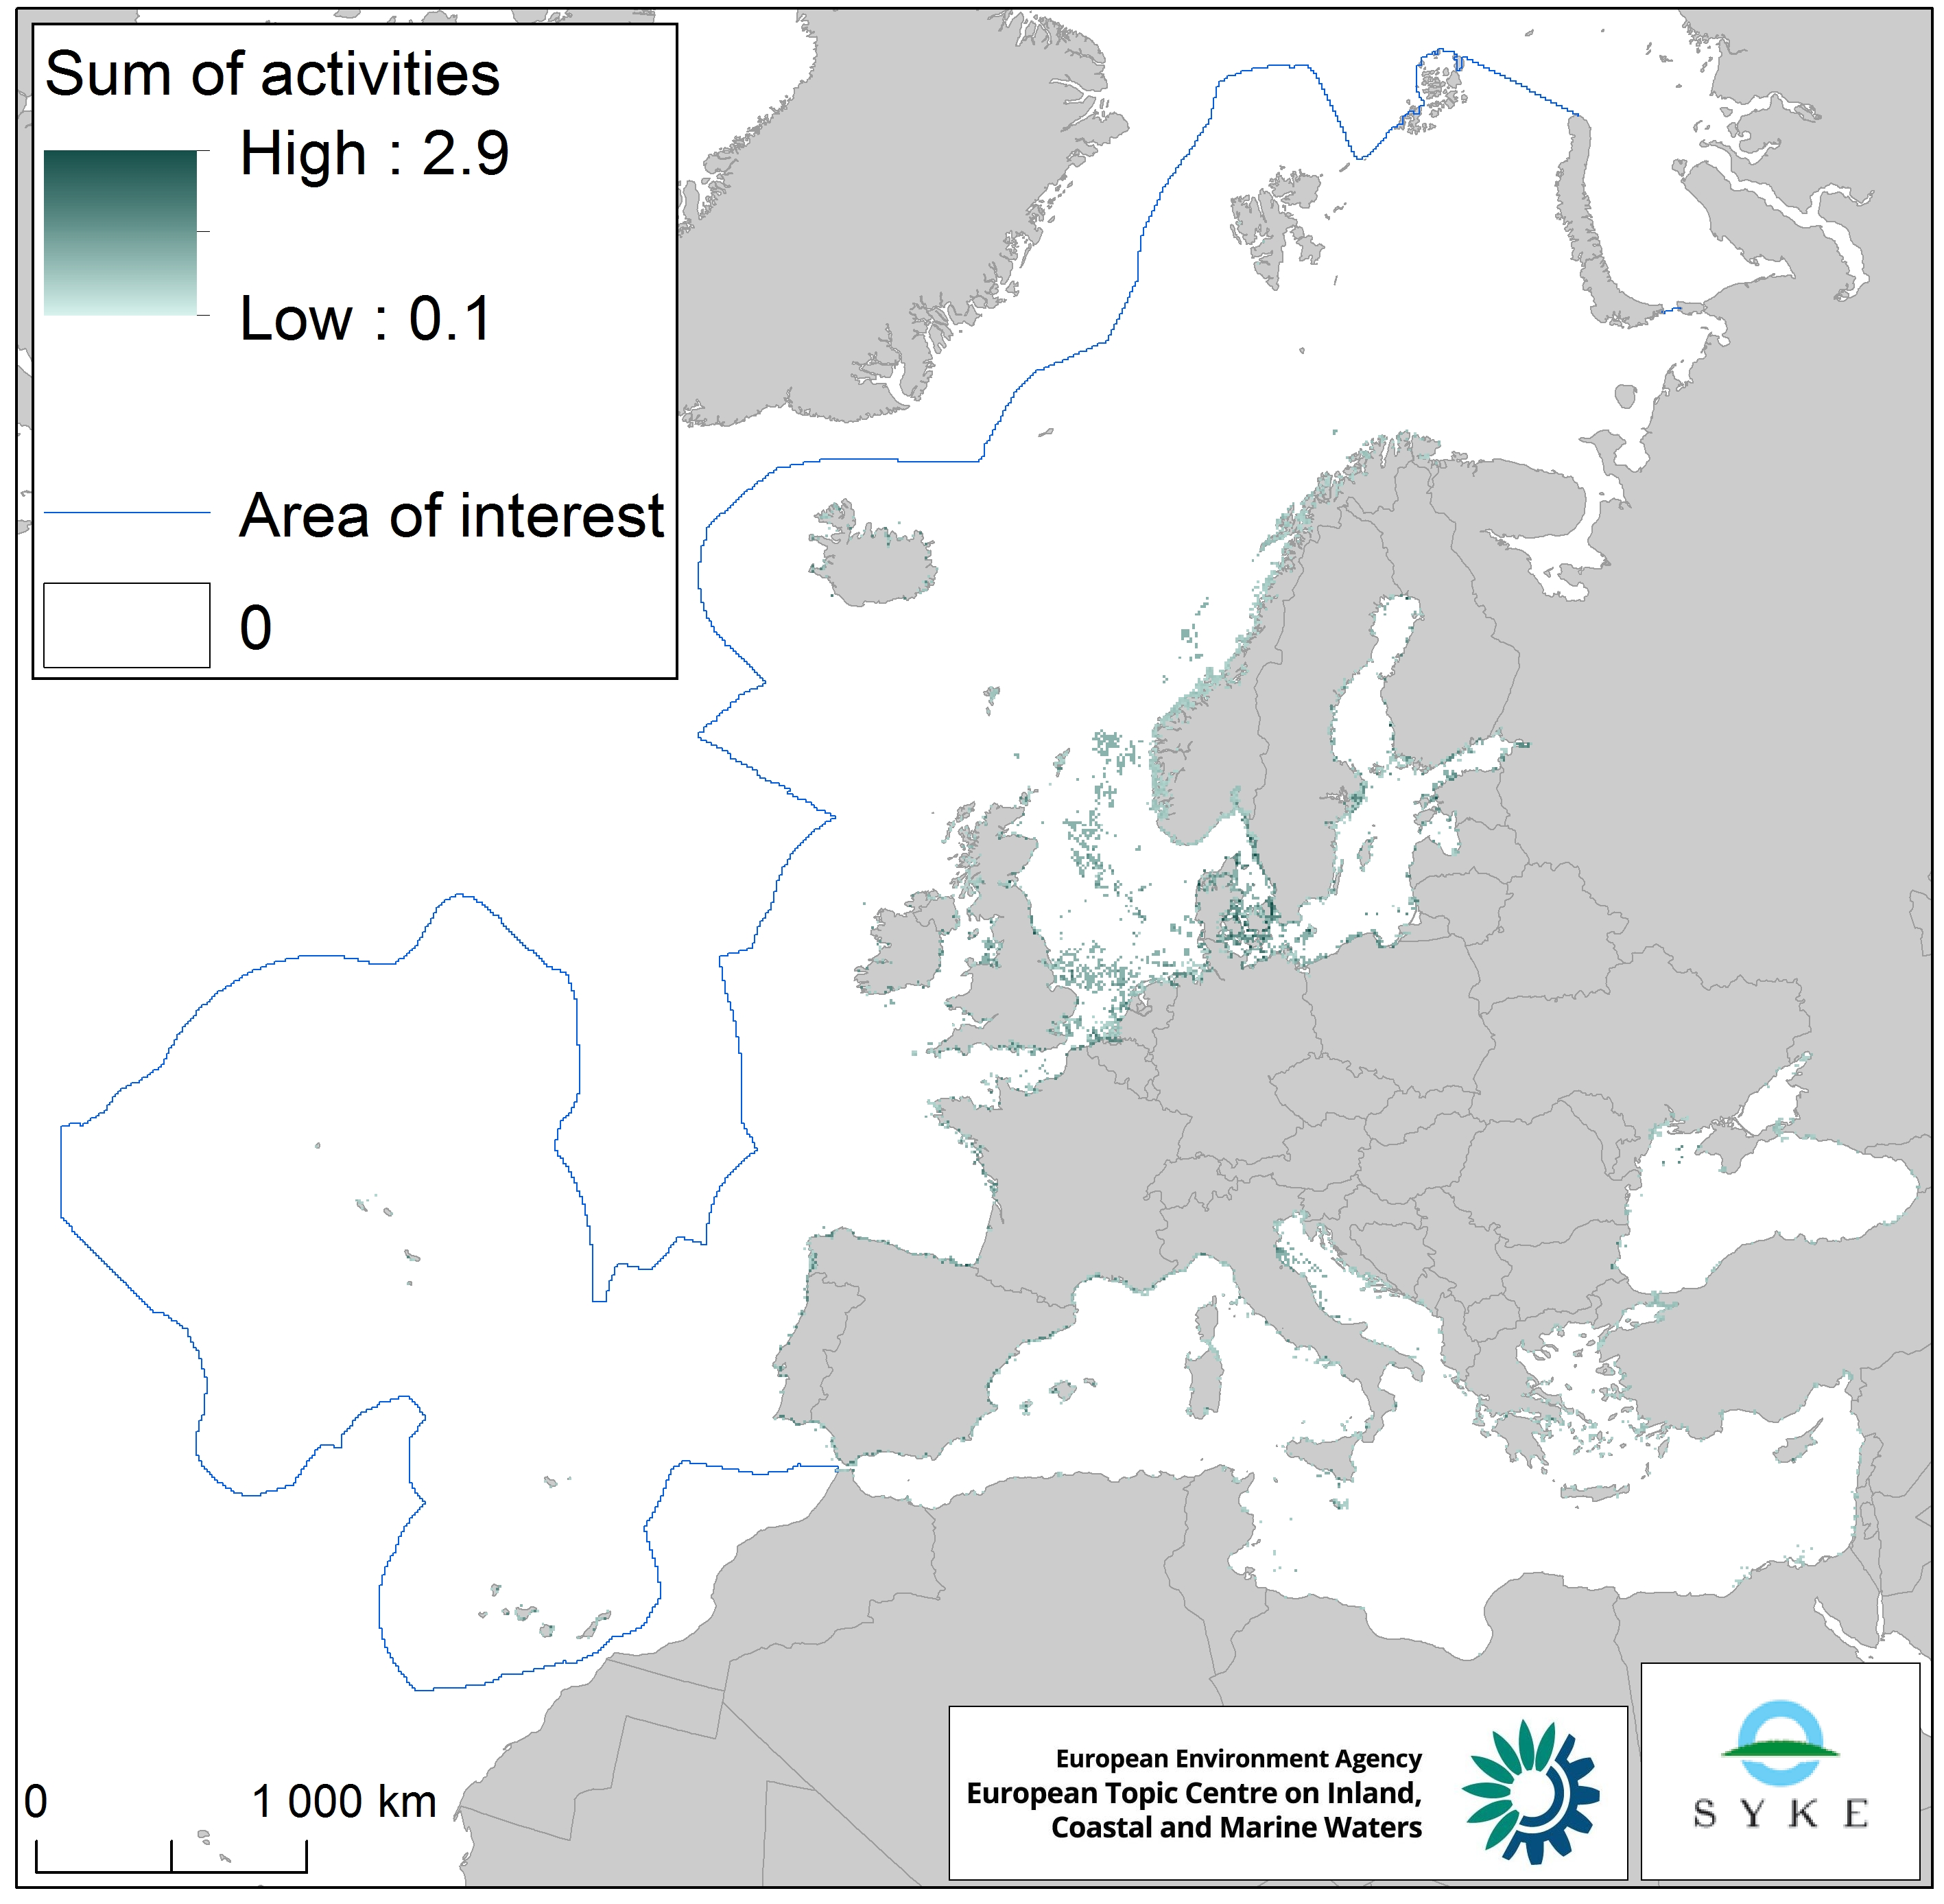
This raster dataset provides the estimation of the extracted tonnes of fish by commercial fishing per 10 km grid cell in the European seas. The dataset has been derived from the combination of demersal and pelagic fishing data, together with fish landings data (2011-2016) from the European Commission’s Joint Research Centre - Independent experts of the Scientific, Technical and Economic Committee for Fisheries (JRC STECF). The temporal extent varies between the data sources. The cell values have been transformed to a logarithmic scale (ln1). This dataset has been prepared for the calculation of the combined effect index, produced for the ETC/ICM Report 4/2019 "Multiple pressures and their combined effects in Europe's seas" available on: https://www.eionet.europa.eu/etcs/etc-icm/etc-icm-report-4-2019-multiple-pressures-and-their-combined-effects-in-europes-seas-1.
-

The ESA Sea State Climate Change Initiative (CCI) project has produced global multi-sensor time-series of along-track satellite synthetic aperture radar (SAR) significant wave height (SWH) data (referred to as SAR WV onboard Sentinel-1 Level 2P (L2P) SWH data) with a particular focus for use in climate studies. This dataset contains the Sentinel-1 SAR Remote Sensing Significant Wave Height product (version 1.0), which is part of the ESA Sea State CCI Version 3.0 release. This product provides along-track SWH measurements at 20km resolution every 100km, processed using the Quach et al statistical model , separated per satellite and pass, including all measurements with flags, corrections and extra parameters from other sources. These are expert products with rich content and no data loss. The SAR Wave Mode data used in the Sea State CCI dataset v3 come from Sentinel-1 satellite missions spanning from 2015 to 2021 (Sentinel-1 A, Sentinel-1 B).
-
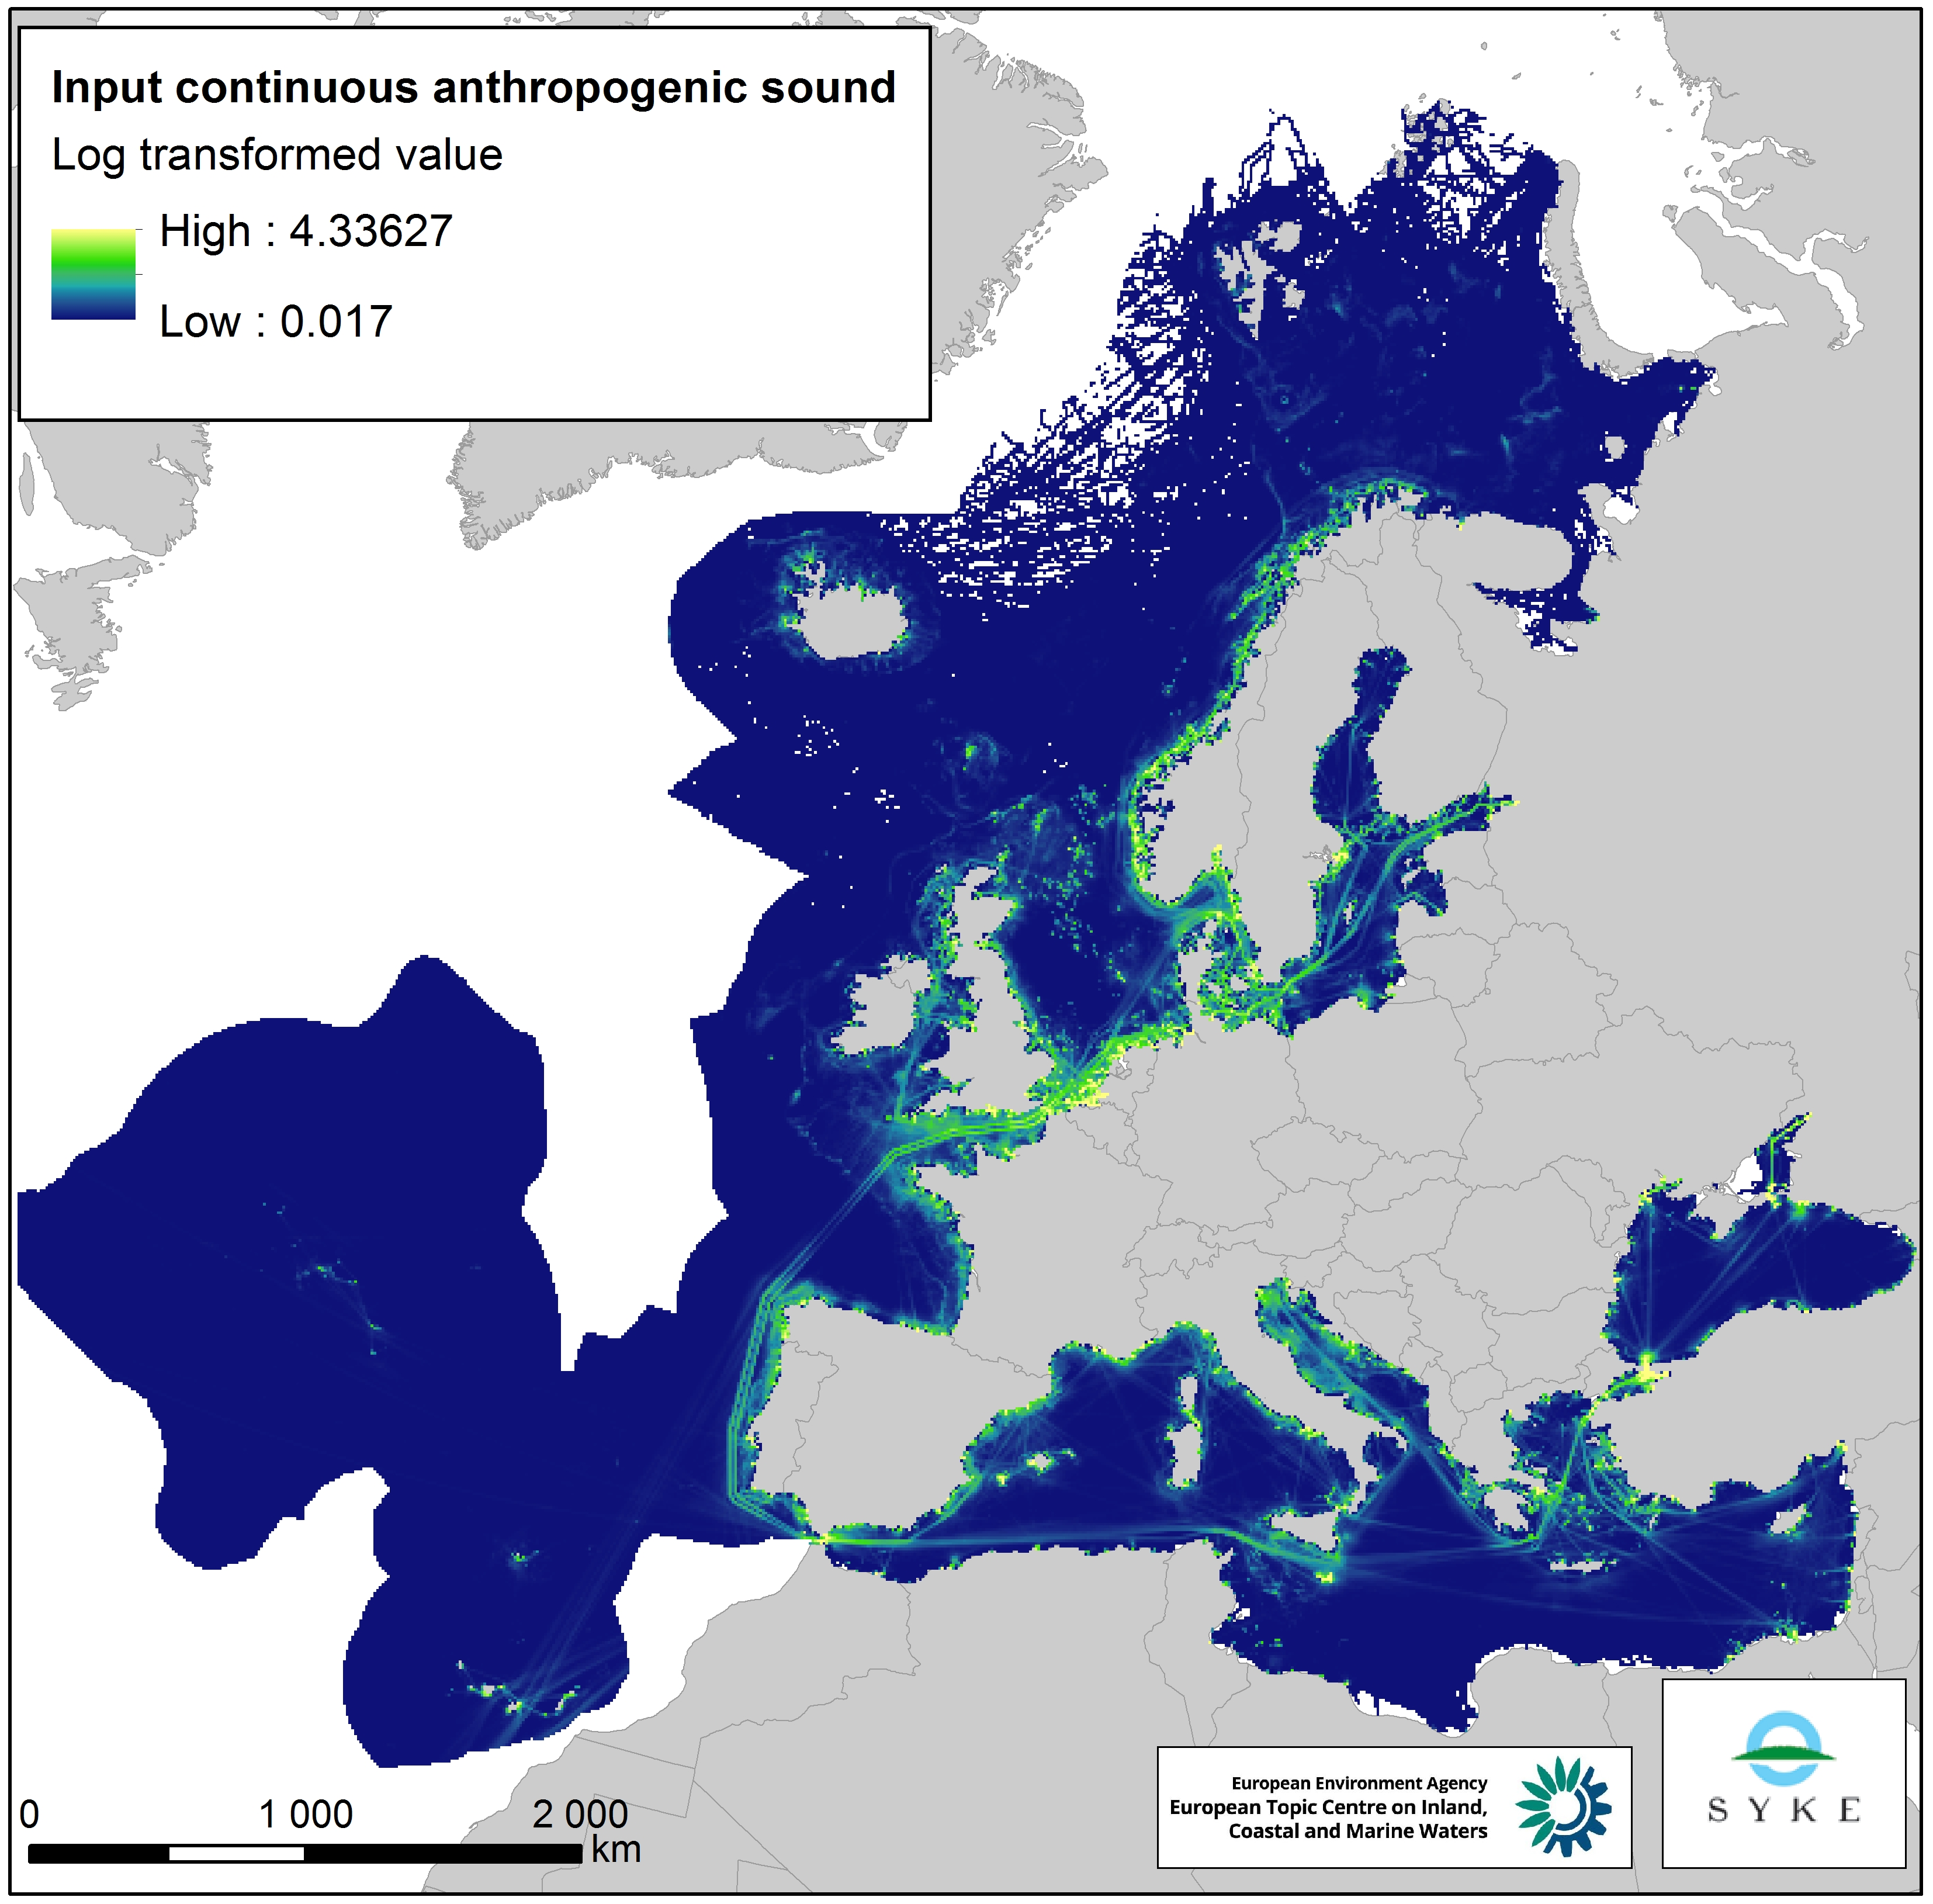
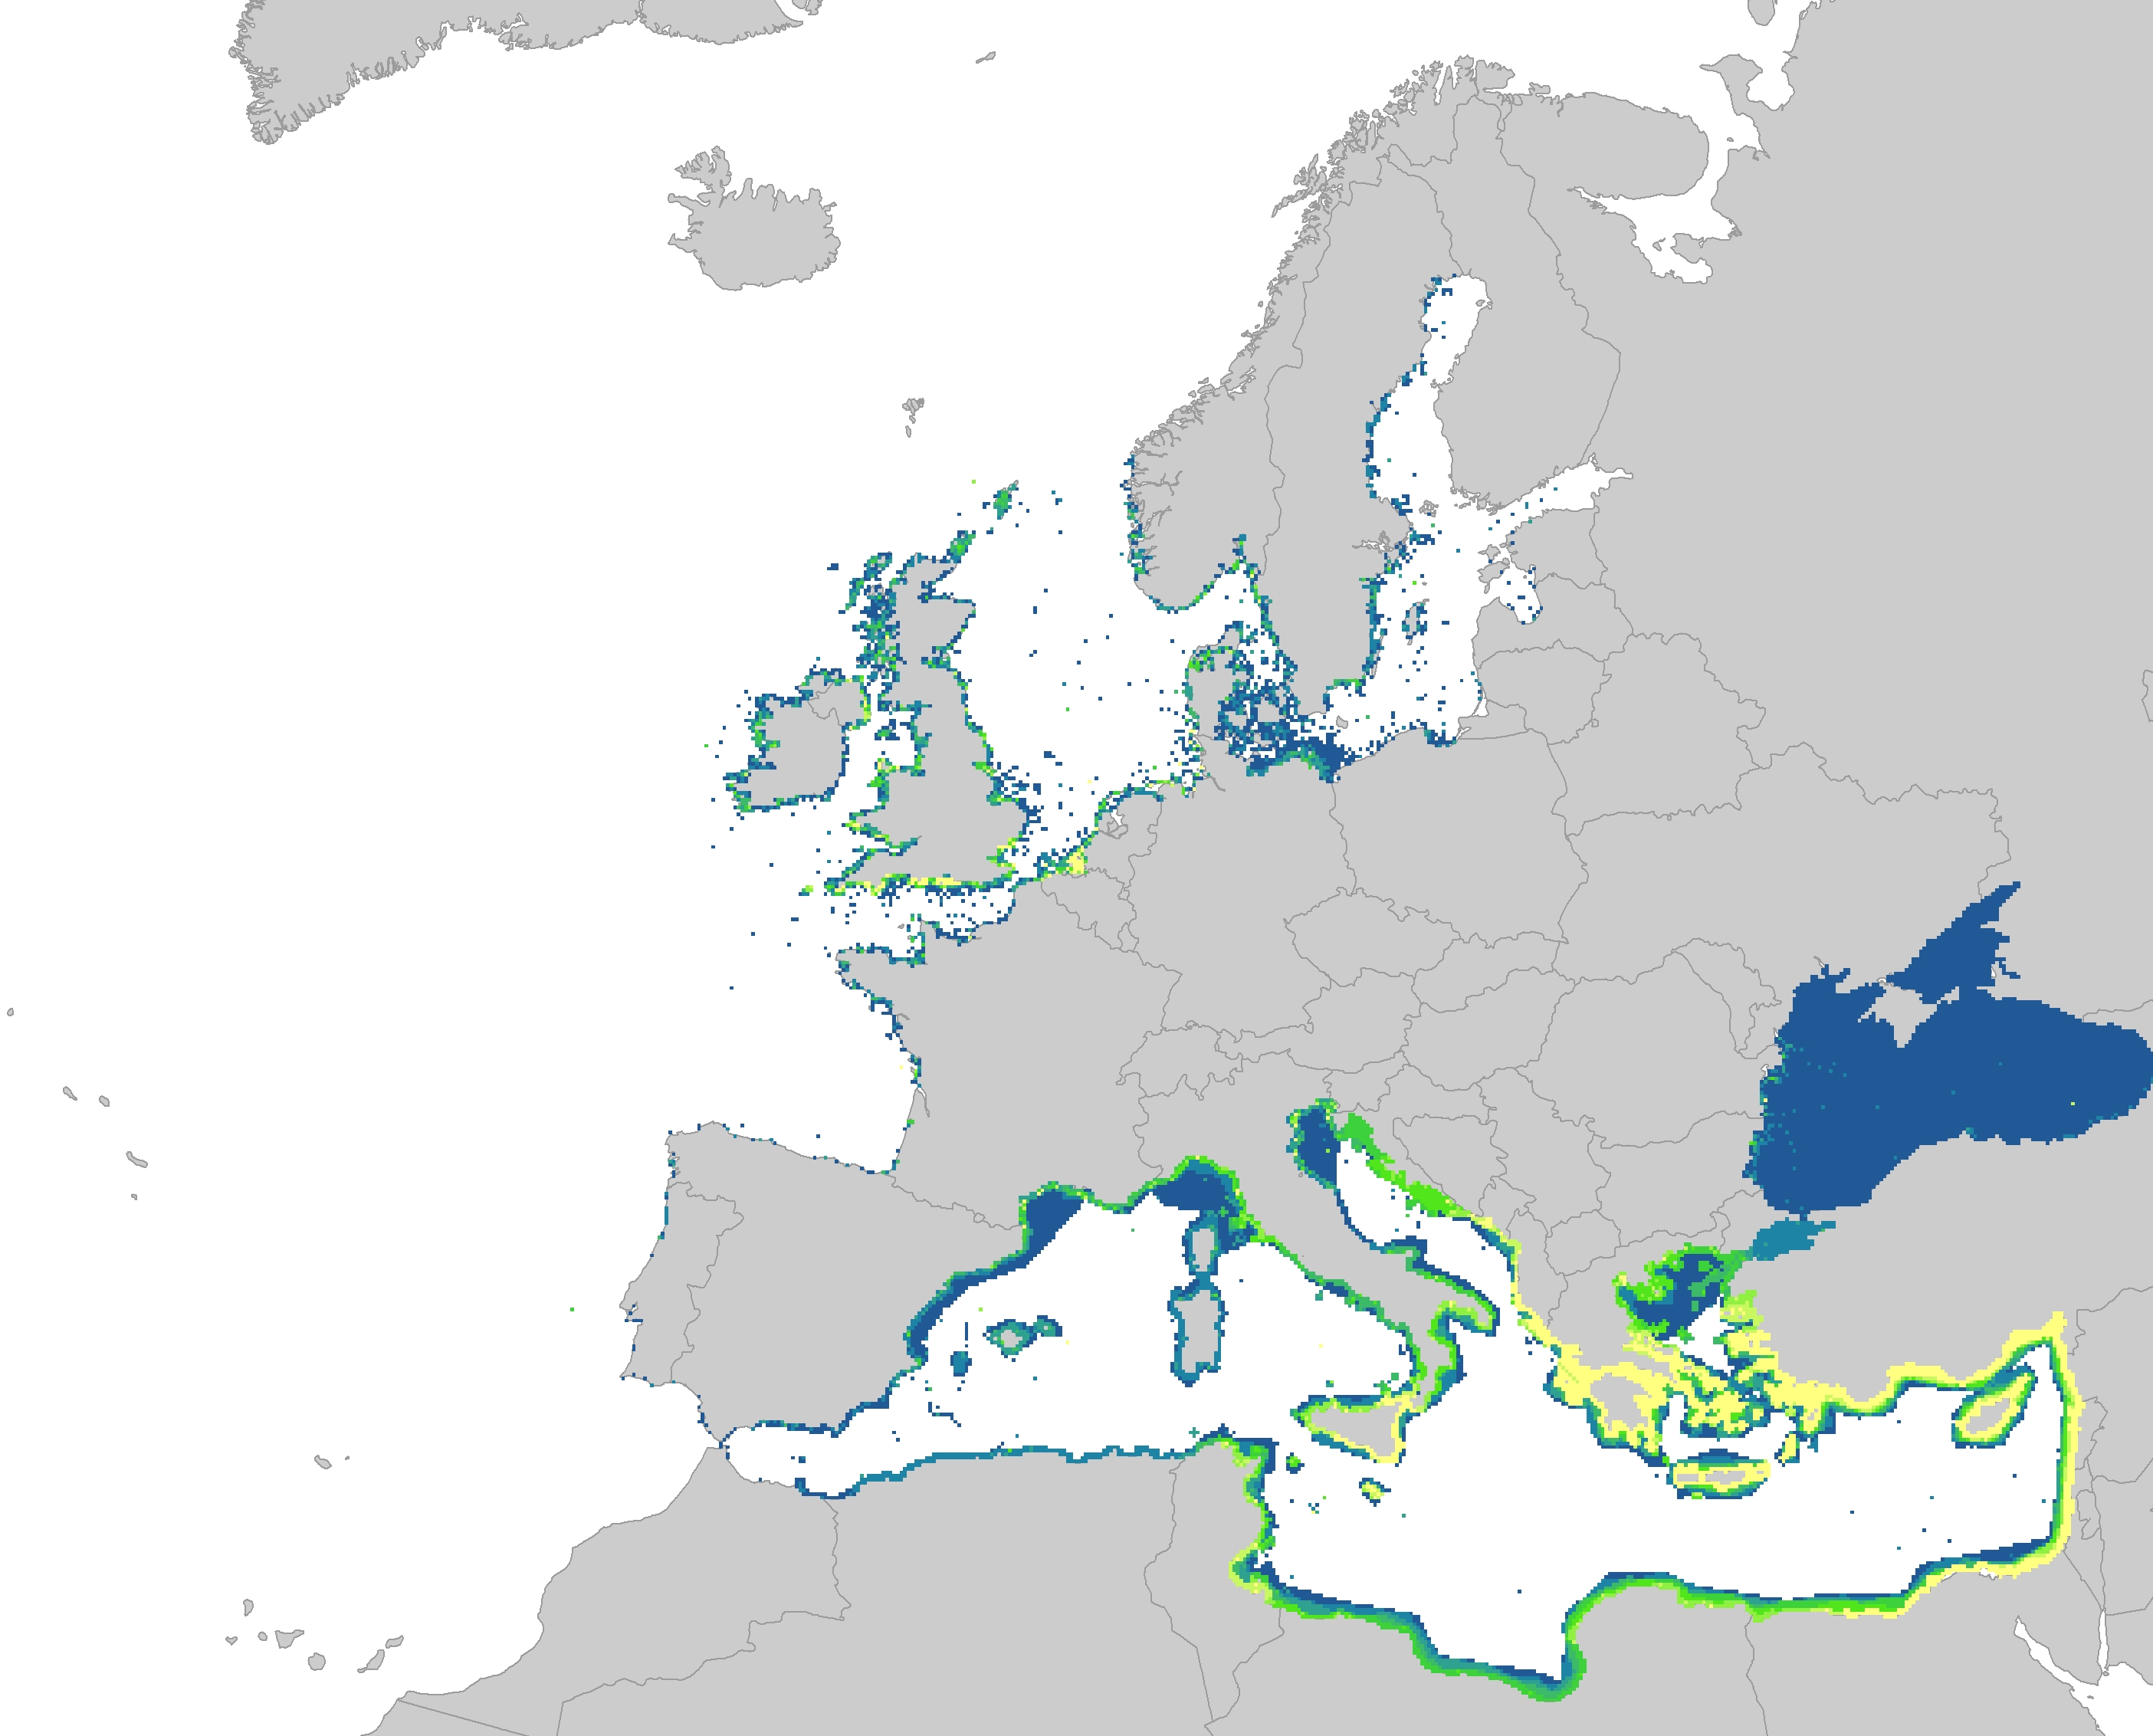
This raster dataset represents the input of continuous anthropogenic sound in the European Seas. Continuous anthropogenic underwater noise is found in the entire European marine area and is mainly produced by maritime traffic. As no thresholds for pressure have been agreed yet, even areas of low or infrequent maritime traffic are included as pressures. This dataset uses shipping density as a representation of distribution of continuous underwater noise. This dataset is based on a truncated version of the EMODnet (Automatic Identification System) AIS based vessel density dataset for 2017 (all ships, year average). The vessel density was rescaled from a 1 km to 10 km resolution (mean values) using the EEA 10 km grid. The dataset has been transformed to a logarithmic scale (ln1). This dataset has been prepared for the calculation of the combined effect index, produced for the ETC/ICM Report 4/2019 "Multiple pressures and their combined effects in Europe's seas" available on: https://www.eionet.europa.eu/etcs/etc-icm/etc-icm-report-4-2019-multiple-pressures-and-their-combined-effects-in-europes-seas-1.
-
This raster dataset represents physical disturbance to the seabed in the European seas. Several human activities disturb the seabed either directly or indirectly. Alteration of benthic living conditions as a result of increased sedimentation or attenuation of light penetration, abrasion of the seabed and exploitation of benthic biota, temporarily disturb the benthic habitat quality. The dataset is an aggregation of several different human activities that cause physical disturbance to the seabed: aquaculture, demersal fishing, dredging and dumping of dredged material, oil and gas rigs, offshore installations, ports, sand and gravel extraction, shellfish mariculture, shipping in shallow waters and windfarms. The resulting dataset is a raster (10km grid cell) derived from EMODnet, MED-IAMER, JRC-STECF, OSPAR, HELCOM and 4C Offshore datasets, and with reference temporal coverage from 2012 to 2017. This dataset has been prepared for the calculation of the combined effect index, produced for the ETC/ICM Report 4/2019 "Multiple pressures and their combined effects in Europe's seas" available on: https://www.eionet.europa.eu/etcs/etc-icm/etc-icm-report-4-2019-multiple-pressures-and-their-combined-effects-in-europes-seas-1.
-
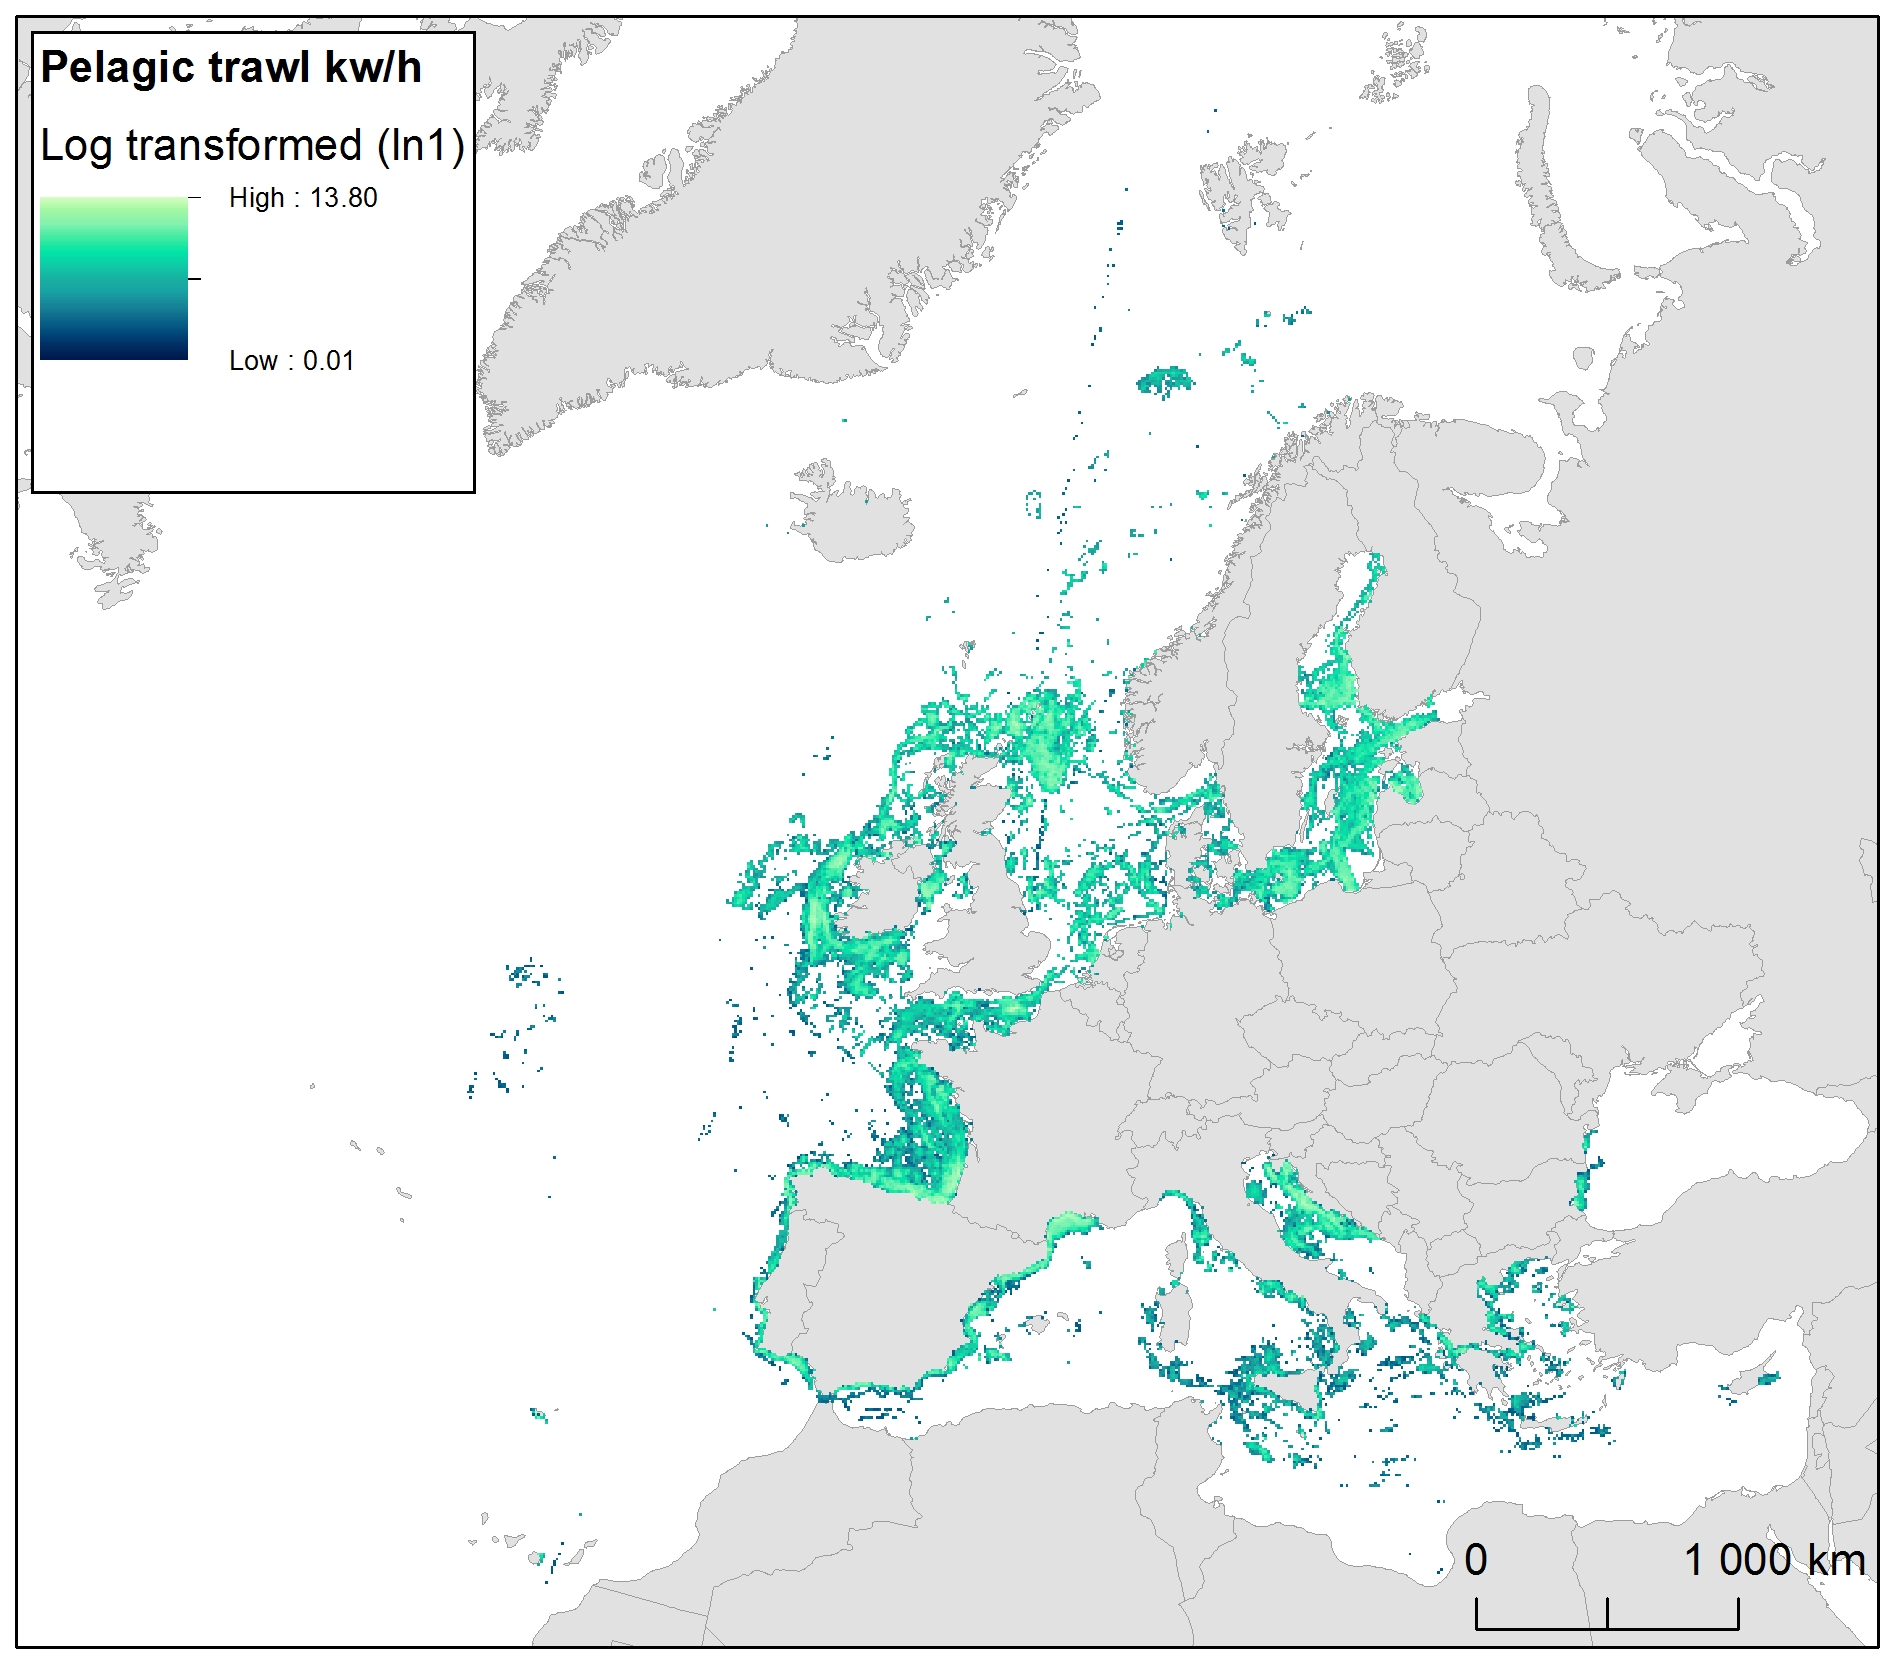
The raster dataset represents fishing intensity (kilowatt per fishing hour) by pelagic towed gears in the European seas. The dataset has been derived from Automatic Identification System (AIS) based pelagic fishing intensity data received from the European Commission’s Joint Research Centre - Independent experts of the Scientific, Technical and Economic Committee for Fisheries (JRC STECF), as well as from Vessel Monitoring System (VMS) and logbook based pelagic fishing effort data from HELCOM Commission. The temporal extent varies between the data sources (between 2013 and 2015). The dataset has been transformed to a logarithmic scale (ln1). This dataset has been prepared for the calculation of the combined effect index, produced for the ETC/ICM Report 4/2019 "Multiple pressures and their combined effects in Europe's seas" available on: https://www.eionet.europa.eu/etcs/etc-icm/etc-icm-report-4-2019-multiple-pressures-and-their-combined-effects-in-europes-seas-1.
-
The dataset represents the introduction of non-indigenous species in European seas. Non-indigenous species are species that have been spread as a result of human activities to areas where they do not belong naturally. The main concern are the invasive species, which are defined as causing a significant negative impact on biodiversity as well as serious economic and social consequences. The dataset has been prepared first by individually mapping each aquatic invasive species that had a distinctive distribution area, which had been provided by several non-indigenous species online databases. The distribution of the species were then resampled into the EEA 10 km grid and summed together, showing the number of non-indigenous species per grid cell. The temporal reference of the dataset covers the last 30 years (1989 - 2018). This dataset has been prepared for the calculation of the combined effect index, produced for the ETC/ICM Report 4/2019 "Multiple pressures and their combined effects in Europe's seas" available on: https://www.eionet.europa.eu/etcs/etc-icm/etc-icm-report-4-2019-multiple-pressures-and-their-combined-effects-in-europes-seas-1.